Data analysis
Data analysis is the process of inspecting, cleansing, transforming, and modeling data with the goal of discovering useful information, informing conclusions, and supporting decision-making. It has applications in various fields such as business, science, social sciences, and technology. The process involves different techniques and tools, ranging from basic statistical analysis to complex algorithms in machine learning and artificial intelligence.
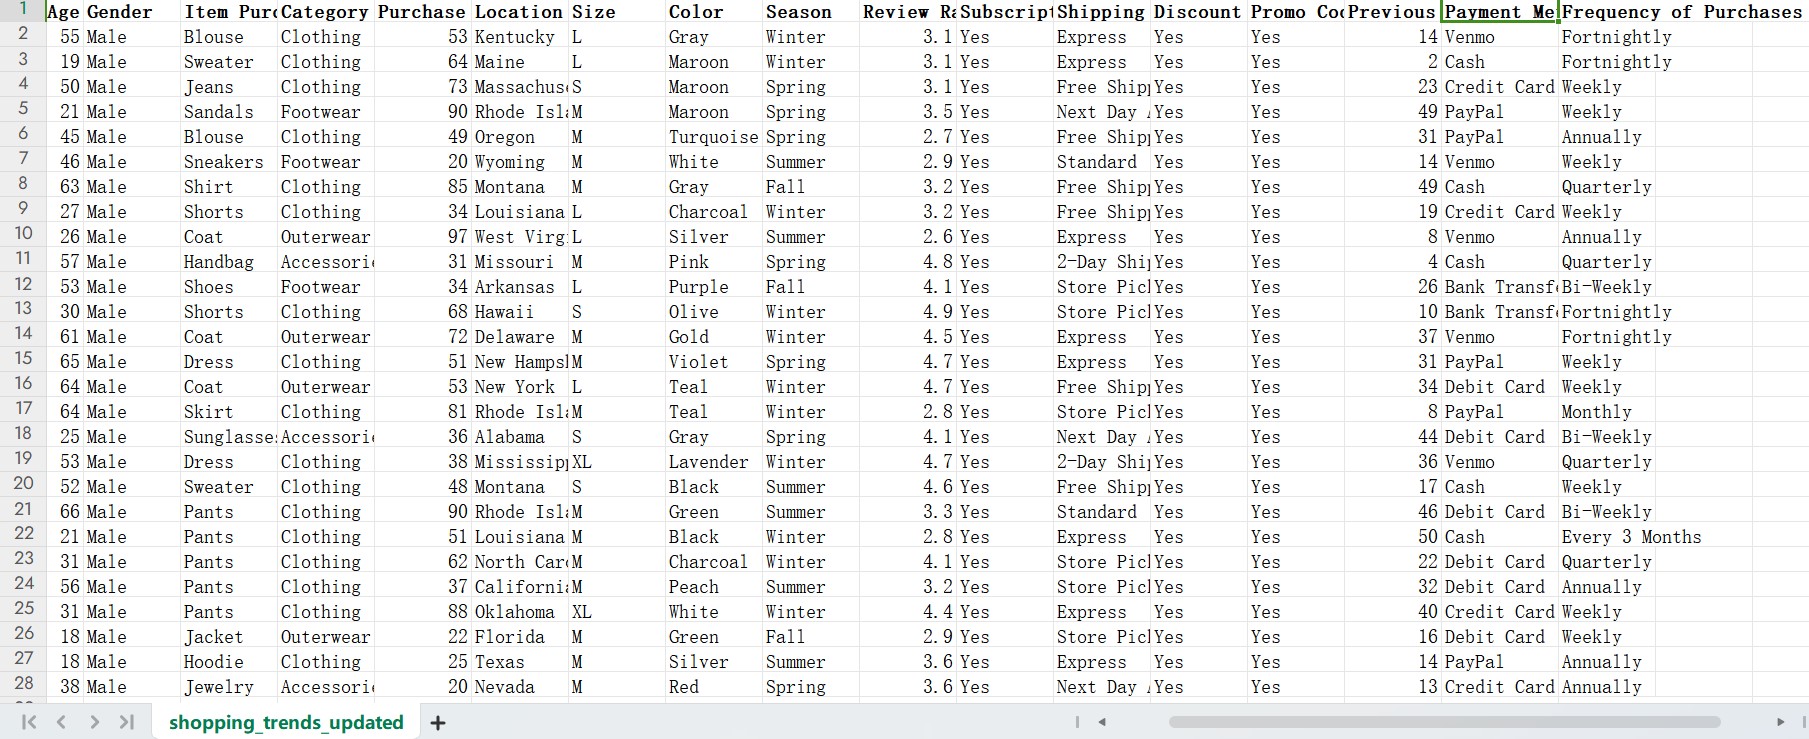
In the simulated scenario of preparing for a promotional campaign, we have conducted an extensive analysis of a hypothetical dataset, originally sourced from Kaggle, representing customer purchases and preferences.This exercise, aimed at understanding key aspects such as product popularity and consumer behavior, revolves around critical variables including age, gender, types of items purchased, product categories, spending amounts, and customer reviews.
To analyze this data for a promotional activity, we can focus on certain key aspects:
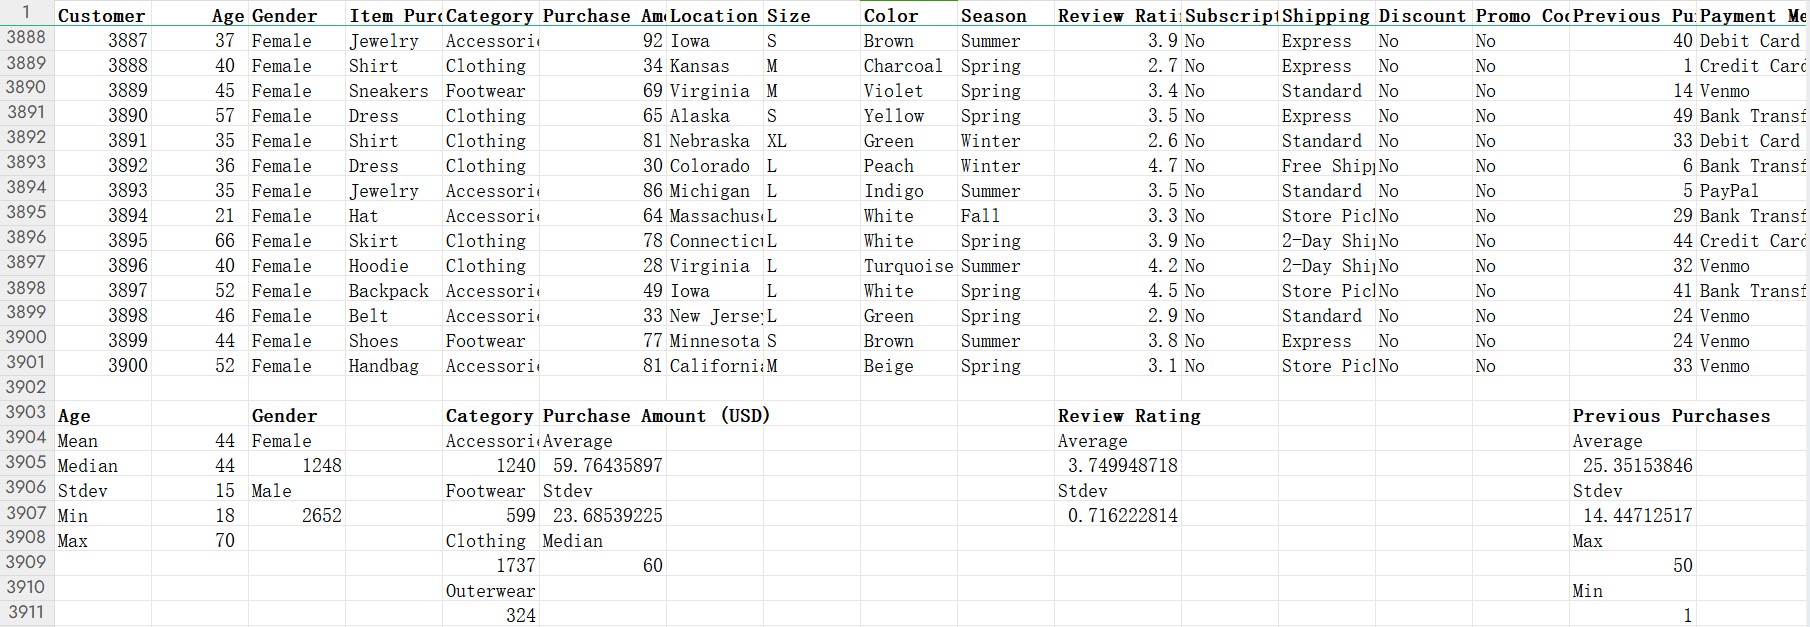
Age: The average age of customers is around 44 years, with a range from 18 to 70 years.
Purchase Amount (USD): The average purchase amount is approximately $59.76, ranging from $20 to $100.
Review Rating: The average product rating is about 3.75, on a scale of 2.5 to 5.
Previous Purchases: On average, customers have made about 25 previous purchases, with a maximum of 50 purchases.
Gender: Customer base is fairly balanced between male and female customers.
Category: The most popular categories are Clothing and Accessories.
Season: Purchases are fairly evenly distributed across seasons, with a slight preference for Fall and Spring.
Discount and Promo Codes: A considerable portion of customers have used discounts and promo codes.
Frequency of Purchases: Customers purchase with varying frequencies, from 'Annually' to 'Weekly'.
The data suggests a strong preference for categories such as clothing and accessories, with items like blouses, jewelry, and pants being particularly popular. Additionally, the distribution of purchases appears consistent across various seasons, indicating potential for targeted seasonal promotions. The simulated data also shows a significant engagement in subscription programs, pointing towards an opportunity for leveraging this aspect in the promotional strategy. The frequent use of discounts and promo codes, coupled with the preference for payment methods such as Credit Cards and PayPal, are identified as vital components in crafting effective promotional tactics. Based on these simulated insights from the Kaggle dataset, the focus of the promotional campaign will be strategically aligned to capitalize on these identified trends and preferences, with the aim of enhancing customer engagement and driving sales in the simulated company environment.
Target Audience: Focus on both male and female customers in the 30-50 age range.
Product Focus: Emphasize Clothing and Accessories, particularly Blouses, Jewelry, and Pants.
Seasonal Promotions: Consider season-specific promotions, especially for Fall and Spring.
Loyalty Programs: Leverage subscription base for targeted promotions.
Discounts and Deals: Utilize discounts and promo codes as they are well-received.